
Statistical Analysis on Import and Export of Ceramic Products from 27 EU States in 2015
Release time:
2016-04-14
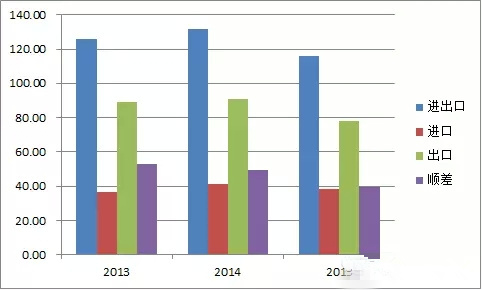
According to the data, the total import and export volume of ceramics in the EU was 11.606 billion billion US dollars, down 11.97 percent from the same period last year. Among them, the export value of ceramics was 7.775 billion US dollars, a year-on-year decrease of 14.28 percent; the import value of ceramics was 3.83 billion US dollars, a year-on-year decrease of 6.97 percent; the trade surplus was 3.945 billion US dollars, a year-on-year decrease of 20.42 percent. See the figure below for details.
Import and Export of Ceramics in EU (Unit: US $billion)
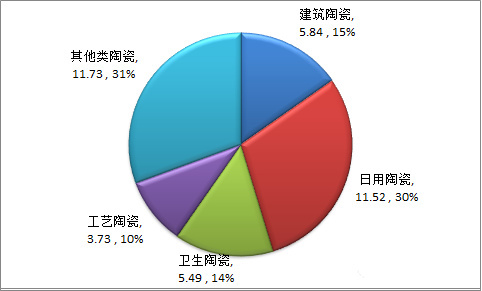
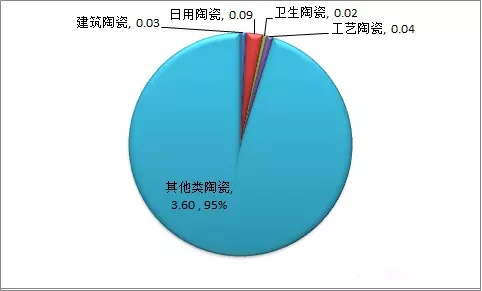
The EU ceramic industry is having a hard time, we Chinese ceramic enterprises have not felt it? First of all to ask building ceramics enterprises, European orders are not less? In 2015, the EU imports of building ceramics $0.584 billion, a year-on-year decrease of 14.95, is the largest decline in all kinds of ceramics. Other types of ceramics and household ceramics, which account for more imports, fell by 5.09 per cent and 5.70 per cent, respectively. Imports of technical ceramics fell slightly, by 4.64 per cent, while imports of sanitary ceramics fell by 5.08 per cent.
Distribution of imports of various types of ceramics in the EU (in US $billion)
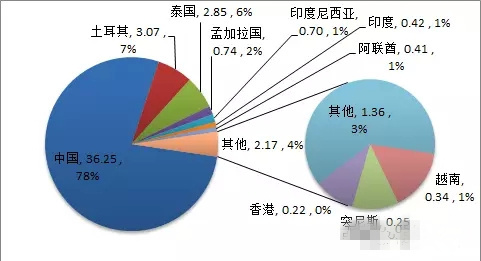
China is still the main source of EU ceramic imports. Followed by Turkey, the United States, Japan, Thailand, the United Arab Emirates, Vietnam, India and Mexico and other countries and regions. In 2015, the EU imported US $1.738 billion billion of ceramics from China, accounting for 45.36 percent of the EU's total imports, a year-on-year decrease of 7.77 percent.
Distribution of ceramic imports from the EU (in US $billion)

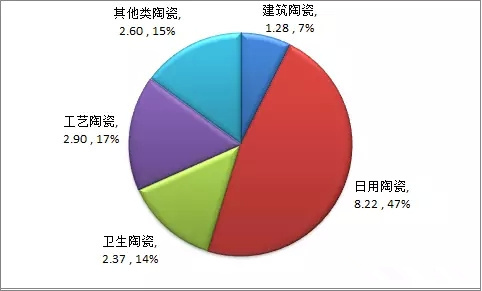
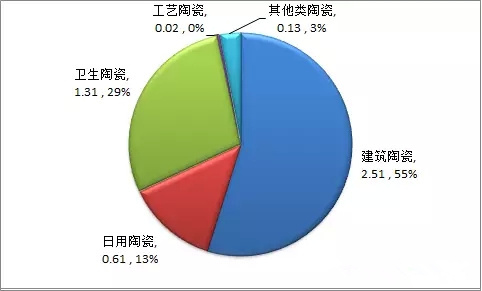
The EU imported ceramics from Turkey to US $0.458 billion, accounting for 11.96 percent, a year-on-year decrease of 10.18 percent; the EU imported ceramics from the United States to US $0.378 billion, accounting for 9.87 percent, a year-on-year decrease of 2.09 percent; and the EU imported ceramics from Japan to US $0.253 billion, accounting for 6.61 percent, a year-on-year decrease of 7.69 percent. The European Union's ceramic imports from China, Turkey and the United States have their own priorities. 47.33 per cent of the total ceramic imports from China are daily-use ceramics, 54.86 per cent of the total ceramic imports from Turkey are architectural ceramics, and 71.33 per cent of the total ceramic imports from the United States are special ceramics, which are classified into other ceramic statistics.
Distribution of ceramic varieties imported by the EU from China (unit: US $billion)
Distribution of ceramic varieties imported by the EU from Turkey (unit: billion US dollars)
Distribution of ceramic varieties imported by the European Union from the United States (unit: billion US dollars)
Mexico, ranked ninth in 2015, made a lot of gains in the EU market. For the second consecutive year, the EU's imports of ceramics from Mexico achieved a substantial increase, with an increase of 46.19 percent, with imports of US $0.071 billion billion, nearly four times that of 2013. The main ceramic varieties imported by the European Union from Mexico are special ceramics, accounting for about 81.38 percent of its total ceramic imports from Mexico. This feature is similar to the United States.
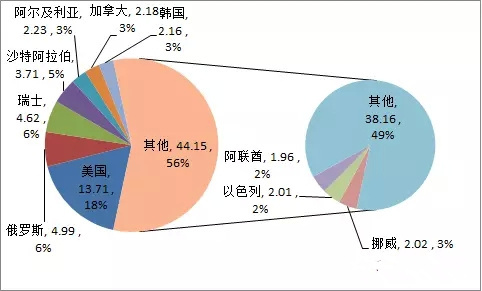
The main export markets of EU ceramics are the United States, Russia, Switzerland, Saudi Arabia, Algeria, Canada, South Korea and other countries and regions. China is the 12th largest export market for EU ceramics. In 2015, the EU exported $1.371 billion billion of ceramics to the United States, accounting for 17.64 percent of the EU's total ceramic exports, a year-on-year decrease of 2.18 percent. As Russia was sanctioned by the European Union and the United States after the Ukraine incident, its currency depreciated and its purchasing power declined. The European Union exported ceramics to Russia for 0.499 billion billion U.S. dollars, a year-on-year decrease of 45.25 percent. The EU exported $0.462 billion billion of ceramics to Switzerland, down 15.22 percent, and $0.371 billion billion to Saudi Arabia, down 9.99 percent. The EU exported ceramics to China to 0.179 billion US dollars, down 23.09 percent year on year.
Distribution of EU Ceramic Export Market (Unit: US $billion)
The main variety of EU ceramic exports is building ceramics. In 2015, the export value was 4.296 billion billion US dollars, a year-on-year decrease of 14.00, accounting for 55.24 of the total ceramic exports. This was followed by other types of ceramics, with exports of US $2.163 billion, down 13.28 per cent from a year earlier. Sanitary ceramics exports fell significantly year-on-year, reaching 22.63 per cent. Exports of domestic ceramics and technical ceramics decreased by 13.96 and 12.43, respectively.
Export distribution of various types of ceramics in the EU (in US $billion)

The following focuses on the analysis of the import and export of EU daily ceramics and craft ceramics.
EU imports of daily ceramics in 2015 $1.152 billion, a decrease of 5.70. Among them, the EU imported 0.822 billion US dollars of daily ceramics from China, a decrease of 5.78. In terms of quantity, the EU imported 466200 tons of daily ceramics in 2015, a decrease of only 2.09. Among them, 362500 tons were imported from China, down 4.48 percent year on year. China's market share in the EU is relatively high, which is more likely to become a target of trade protectionism when the EU economic situation is not optimistic. In this regard, our company must do a good job in transformation and upgrading, strengthen cooperation with EU industries, and avoid trade frictions. Other major EU countries importing daily ceramics are Thailand, Turkey, Indonesia and Bangladesh. EU imports from these countries have declined. However, the European Union from Turkey, Bangladesh, India, the United Arab Emirates, Vietnam, Tunisia and other countries, the weight of daily ceramics has increased significantly, an increase of 4.32 per cent, 6.88 per cent, 70.19 per cent, 28.31 per cent, 25.70 per cent and 25.34 per cent, respectively.
Distribution of the source of the amount of daily ceramics imported from the EU (in billions of US dollars)

Distribution of weight sources of daily ceramics imported from the EU (in tons)
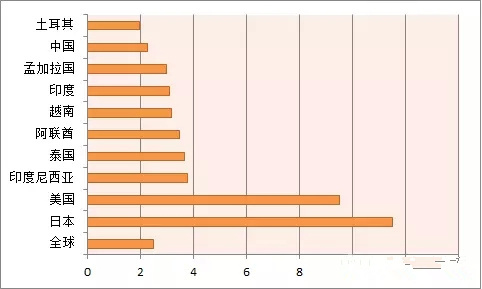
Judging from the average unit price of imports, Turkey's unit price is 1.97 US dollars/kg, which is quite competitive. The EU's average unit price of daily-use ceramics imported from the world fell by 3.68 per cent, while the average unit price of imports from China fell by only 1.37 per cent, compared with 6.75 per cent, 16.75 per cent, 2.19 per cent, 11.51 per cent, 22.04 per cent and 32.61 per cent in Thailand, Turkey, Indonesia, Bangladesh, the United Arab Emirates and India, respectively.
Average unit price of imported ceramics for daily use in EU (unit: USD/kg)
Incidentally, the export of daily ceramics from the EU is mentioned. In 2015, the EU exported 0.735 billion US dollars of daily ceramics, a decrease of 13.96. Of the top ten markets, only the UAE is growing. China ranked 11th with an amount of 0.013 billion US dollars, an increase of 5.69. It is not easy!
Market distribution of daily ceramics exported from EU (in US $billion)

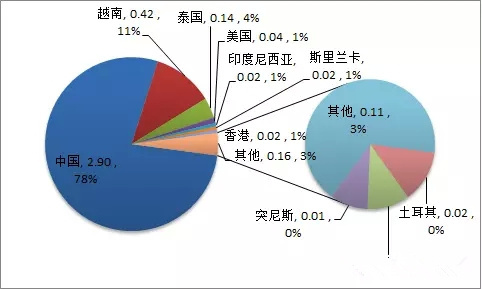
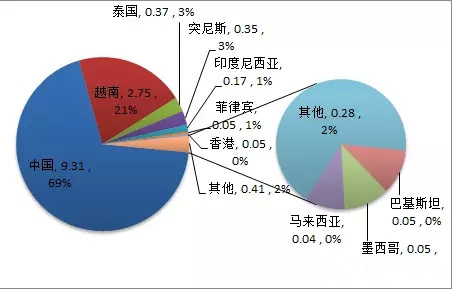
In 2015, the EU imported 0.373 billion US dollars of craft ceramics, a year-on-year decrease of 4.64, of which 0.29 billion US dollars were imported from China, a year-on-year decrease of 6.65. The weight of imported craft ceramics in the EU was 134800 tons, a year-on-year decrease of 2.48 percent, of which 93100 tons were imported from China, a year-on-year decrease of 6.72 percent. China's market share is still large, while Vietnam and Thailand, the two younger brothers, are firmly in the second and third positions. In 2015, EU imports from Vietnam amounted to US $0.042 billion, a decrease of 0.79 per cent, and imports weighed 27500 tons, an increase of 12.24 per cent. EU imports from Thailand amounted to US $0.014 billion, up 35.04 per cent year-on-year, and imports weighed 3700 tons, up 32.29 per cent year-on-year.
Distribution of the source of the amount of imported craft ceramics from the EU (in billions of US dollars)
Distribution of weight sources of imported process ceramics from the EU (in tons)
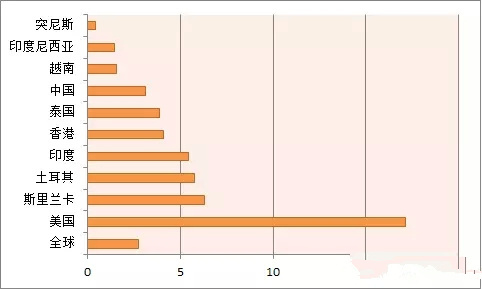
The average unit price of imported craft ceramics from the EU was US $2.76/kg, down 2.22 per cent year-on-year, while the average unit price of imported craft ceramics from China was US $3.11/kg, up 0.07 per cent year-on-year. Prices also rose in Thailand, with an average unit price of $3.87/kg, up 2.07 per cent. The price drop is led by Vietnam, as well as Indonesia, the United States, Tunisia and so on. The average unit price in Vietnam has dropped by 11.61, and that in Indonesia by 8.75. The average annual price in these two countries is less than US $2/kg, while that in Tunisia is only US $0.42/kg. Let's take a look at how people sell ceramics in the United States. The average unit price is 17.12 US dollars/kg. The EU also imported 3.69 million US dollars, second only to China, Vietnam and Thailand. Chinese enterprises should refuel!
Average unit price of imported craft ceramics from EU (unit: USD/kg)
Finally look at the EU craft ceramics exports.
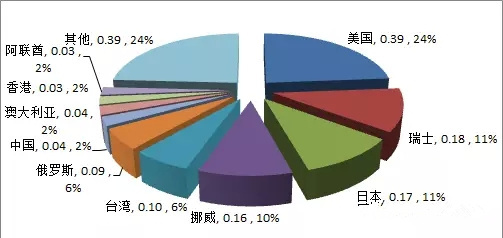
The EU exported technical ceramics in 2015 to US $0.163 billion, weighing 18100 tons, with an average export unit price of US $9.02/kg. The EU ceramic export market is relatively scattered, and the largest market is still the United States, with exports of 0.039 billion billion US dollars, an increase of 3.04 per cent over the same period last year. China is the seventh market for EU craft ceramics exports, with EU exports to China worth US $0.004 billion billion, down 45.03 per cent from the same period last year.
Market Distribution of EU Export Process Ceramics Amount (Unit: US $billion)
Recommend Content
Share

Address
Shenhou Town, Yuzhou City, Xuchang City, Henan Province, China
SAF Coolest v1.3.1.1 设置面板 JPGSS-ZJJT-JDAXE-ZFV
无数据提示
Sorry, the current column has no content for the time being.!
You can view other columns or returnHome Page